The Multitrait-Multimethod (MTMM) approach
Measurement always occurs with errors. This means that there is a difference between the variable one wants to measure and the observed variable. These errors can be random errors, just determined by chance and systematic errors which are connected with the measurement procedure. So one could formulate that the observed variable ($y$) is determined by the trait ($F$) one wants to measure, random errors ($e$) and the systematic effect related to the method ($M$) used :
$Y = a + b F + M +e$ (1)
The coefficients $a$ and $b$ are respectively the intercept and slope of the relationship between the observed variable and the trait.
Standardizing the observed variable, trait and method effect variable the following equation is obtained:
$Y = q F + s M + e$ (2)
where the coefficient $q$ represents the strength of the relationship between the trait of interest ($F$) and the observed variable ($Y$). The explained variance in the observed variable by the trait of interest is equal to $q^{2}$ and has been denotes as the quality of the observed variable for the specified trait. The coefficient $s^{2}$ represents the strength of the relationship between the systematic error component related to the method used and the observed variable. The explained variance in the observed variable by systematic errors connected to the method is equal to $s^{2}$, witch is also denoted as the method variance. The variances of $e$ is the variance of the random errors in the observed variable.
The Multitrait-Multimethod experiment
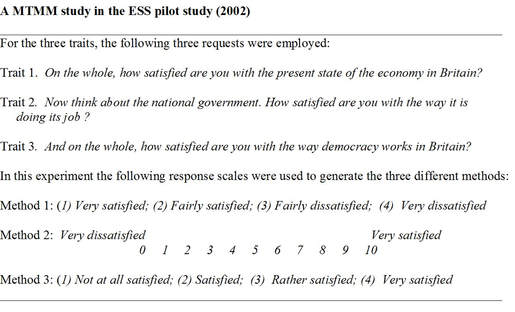
The above model cannot be estimated because only $y$ is observed. So one needs repeated observations as suggested by the classical test theory (Lord and Novick 1956).Campbell and Fiske suggested that each measure introduces its own errors and these can only be detected if different methods are used in one experiment. They suggested the Multitrait-Multimethod experiment with at least three traits and three methods. An example of such an experiment done in the European Social Survey (ESS) is presented below.
The above model cannot be estimated because only $y$ is observed. So one needs repeated observations as suggested by the classical test theory (Lord and Novick 1956).Campbell and Fiske suggested that each measure introduces its own errors and these can only be detected if different methods are used in one experiment. They suggested the Multitrait-Multimethod experiment with at least three traits and three methods. An example of such an experiment done in the European Social Survey (ESS) is presented below.
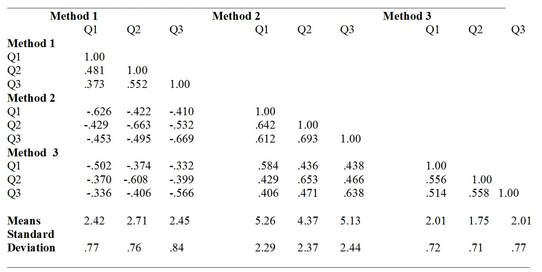
Such an experiment produces a correlation matrix of 9 (3x3) variables. For these questions the correlation matrix the means and the standard deviations were as follows
The classical MTMM model
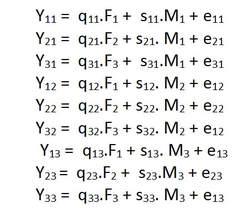
Several researchers suggested to analyze the data from such experiments with Structural Equation Models. Andrews (1984) was the first to apply the combination of the MTMM experiment with survey questions, collecting data from several of such experiments and to estimate the quality of these survey questions of such experiment using structural equation models. The model he used was a factor model with 3 trait factors and 3 method factors to explain the correlations between the 9 observed variables.
Several researchers suggested to analyze the data from such experiments with Structural Equation Models. Andrews (1984) was the first to apply the combination of the MTMM experiment with survey questions, collecting data from several of such experiments and to estimate the quality of these survey questions of such experiment using structural equation models. The model he used was a factor model with 3 trait factors and 3 method factors to explain the correlations between the 9 observed variables.
This model with 9 observed variables ($y_{ij}$) is identified if one assumes, like Andrews did, that the random errors are uncorrelated with each other, with the traits and the method factors and that the method factors are uncorrelated with the trait factors and are also not correlated with each other.
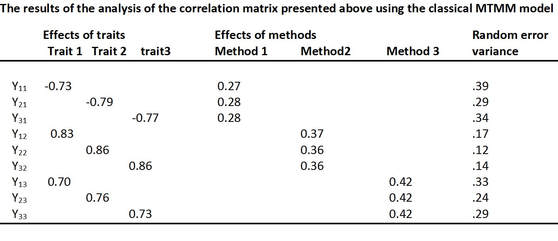
Using this specification of the model for the explanation of the correlation matrix presented above, the following standardized effects were obtained.
Using this specification of the model for the explanation of the correlation matrix presented above, the following standardized effects were obtained.
These results show for example that for question 1 ($y_{11}$) in method 1 only 53% ( .73 squared) of the total variance comes from the trait 1 ( quality of the measure), 7% (.27 squared) is systematic error variance due to the method 1 and 39% is random error variance. In the same way the other questions can be evaluated.
We can also directly compare the quality coefficients and see that for method 2 all three questions have the highest quality coefficients compared with the other two methods. This is not necessarily true for different topics. Therefore, many experiments with different topics and methods are necessary.
Reference:
Andrews F. M. 1984. Construct validity and error components of survey measures: A structural equation approach. Public Opinion Quarterly, 48, 409─442.


