Variation in Response Functions
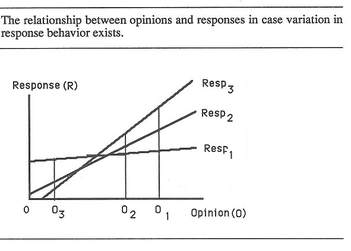
In a book published in 1988, edited by Saris, it was shown by several experiments that people use different scales for evaluating objects. They even evaluate the sizes of rectangles differently while we all know the relative sizes. This happens when people use category scales but also with continuous scales. In the picture shown at the right we illustrate this phenomenon what is called "variation in response functions". The people having the same opinion O1 express this same opinion in very different ways. These differences are due to differences in the way they answer. We say there is variation in the response function between the respondents. For comparison of opinions of people based on their responses the response functions should be the same. However, often this will not be the case even if they evaluate sizes of rectangles. Looking at a single opinion one may think that there is measurement error. However that is not the case because all people may give very precise answers but in their own way. The conclusion is that one can not compare responses of respondents unless the response functions are the same.
An annoying consequence
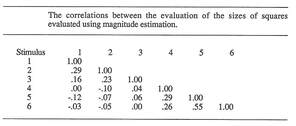
The picture at the left shows the consequences of the variation in response functions for the correlations between responses.
If we order the stimuli with respect to their position on a continuum (for example the sizes of rectangulars) then the responses to stimuli close to each other will get a higher correlation than items further aways. The items at the ends of the scales may even correlate negatively with each other.
These extra correlations due to variation in response functions disturb the pattern of correlations and cause analysis problems. Without preventing these correlations to occur one may draw rather wrong conclusions on the basis of such correlation matrices.
The solution
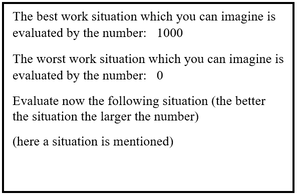
The solution to this problem is to use not just one reference point but two so called fixed reference points.
Fixed reference points are points that give for all respondents the same connection between the subjective scale and the response scale. So, for example in case of judgements of occupations with respect to status one can use as fixed reference points : 0 indicating the lowest possible status and 100 indicating the highest possible status. In case of evaluations of objects the two fixed reference ponts would be: 0 indicates the worst possible and 1000 the best possible. These two reference points are fixed reference points because the relationship between the two points on the opinions scale and the response scale will be for all respondents the same. This is not so if the end points of the scales were chosen to be as follows "0 = bad" and "100 = good" because then there can still be differences of opinion between the respondents about bad and good. Some will interpret it as extremely bad and extremely good while others see these points as just bad and good.
For a satisfaction scale one can also do the same 0 = extremely dissatisfied and 100 extremely satisfied.
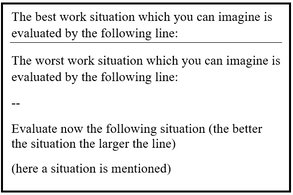
This solution can be applied on other continuous scales or category scales.
For job satisfaction we can specify the questions as following
The solution to this problem is to use not just one reference point but two so called fixed reference points.
Fixed reference points are points that give for all respondents the same connection between the subjective scale and the response scale. So, for example in case of judgements of occupations with respect to status one can use as fixed reference points : 0 indicating the lowest possible status and 100 indicating the highest possible status. In case of evaluations of objects the two fixed reference ponts would be: 0 indicates the worst possible and 1000 the best possible. These two reference points are fixed reference points because the relationship between the two points on the opinions scale and the response scale will be for all respondents the same. This is not so if the end points of the scales were chosen to be as follows "0 = bad" and "100 = good" because then there can still be differences of opinion between the respondents about bad and good. Some will interpret it as extremely bad and extremely good while others see these points as just bad and good.
For a satisfaction scale one can also do the same 0 = extremely dissatisfied and 100 extremely satisfied.
This solution can be applied on other continuous scales or category scales.
For job satisfaction we can specify the questions as following
|
|
For the mathematical presentation of this problem and the suggested solution we can refer to an article of Saris (1988). For a more elaborate discussion of the experiments on which this research is based we refer to the book about Variation in Response functions that is edited by Saris (1988). A lot of applications of this approach can be found in the questionnaires of the European Social Survey. The meta analysis of many of experiments with different scale types showed that the line production method gave the best quality (Saris and Gallhofer 2007).
References:
Dawson W.F. and Brinker R.P. (1971) Validation of ratio scales of opinion by multi-modality matching. Perception and Psychophysics, 9, 413-417
Saris W.E. (1988) Individual response functions and correlations between judgments, In W.E.Saris and I.N. Gallhofer (eds) Sociometric Research Volume 1 Data collection and scaling. London , MacMillan.
Lodge M. (1981) Maginitude scaling: Quantitative measurement of opinions. Sage University Papers Series on quantritative application in the social sciences. Beverly Hills. Sage
Saris W.E. (1988) A measurement model for psychophysical scaling. Quality & Quantity, 22, 417-433
Saris W.E (1988) Variation in response functions: a source of measurement error in attitude research. Amsterdam, SRF
Saris W.E and I.N. Gallhofer (2007) Design, evaluation and analysis of questionnaires for survey research. Hoboken, Wiley.
